Indices
Eurekahedge Asset Weighted Index Analysis Report
EQUAL WEIGHTED HEDGE FUND INDICES
ASSET WEIGHTED HEDGE FUND INDICES
SPECIALIST ALTERNATIVE FUND INDICES
INVESTIBLE BENCHMARK INDICES
METHODOLOGIES
INDEX PRESS RELEASES
- Index Flash Update (June 2022)
- Index Flash Update (May 2022)
- Index Flash Update (April 2022)
- Eurekahedge launch four benchmark indices tracking volatility-based investment strategies
- Eurekahedge and MPI announce new benchmark index tracking the top 50 hedge funds
- Eurekahedge and ILS Advisers launch new USD hedge index
- Eurekahedge launches new insurance linked securities index
- Eurekahedge Asset Weighted Index goes live
- Eurekahedge Asset Weighted Index press release
- EU Benchmark Regulation
| Replicating the returns of Eurekahedge Top 100 Asset Weighted Index in a real portfolio | ||||||||||||||||||||||||||||||||||||||
|---|---|---|---|---|---|---|---|---|---|---|---|---|---|---|---|---|---|---|---|---|---|---|---|---|---|---|---|---|---|---|---|---|---|---|---|---|---|---|
|
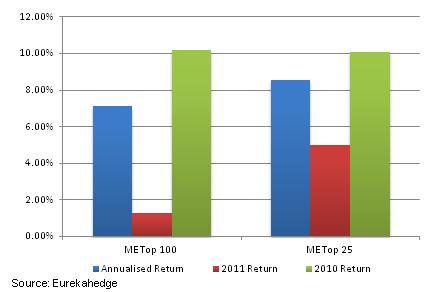
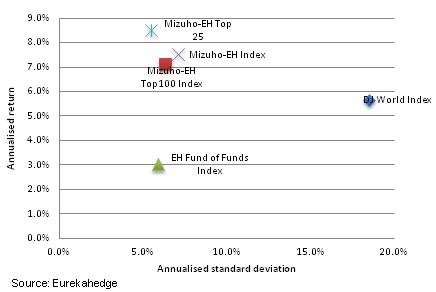
As mentioned earlier the Eurekahedge Top 100 Asset Weighted Index does not suffer from backfill bias so these are the actual returns provided net of fees if one had invested in this index from inception to now. Of course this is a large generalisation by not taking into account whether a fund is closed or not, whether they would accept a minimum amount of capital and whether they pass due diligence tests3. In this section we compare the overall Eurekahedge Top 100 Asset Weighted Index against a portfolio of the top 25 constituents of the index. We use the top 25 for comparison as 20-30 funds is the portfolio size of many funds of hedge funds4 and in addition is a sensible number of investments for the average institutional investor. Interestingly from a risk-return perspective the top 25 funds have delivered significantly better performance, with an annualised return of 8.53%, a low volatility of 5.5% and a Sharpe ratio of 1.19 while the maximum drawdown stands at -10.6% in 2008. These numbers also compare favourably with funds of hedge funds as shown in Figure 3. The numbers imply that a passive portfolio of the 25 largest constituents of the Eurekahedge Top 100 Asset Weighted Index , rebalanced quarterly, should outperform the larger index as well as the average fund of hedge fund – in fact the this portfolio outperforms 92% of the funds in the Eurekahedge Fund of Funds database5 over the January 2005 to September 2011 period. Figure 2: Performance of the top 100 and top 25 funds
Table 4: Risk-return statistics of Eurekahedge Top 100 Asset Weighted Index, top 25 funds and
Source: Eurekahedge Figure 3: Comparative risk-return profile of Eurekahedge Asset Weighted Index
To get a more real perspective, out of the top 25 funds as at July 2011, 3 are closed to new investors – as such 22 out of these 25 funds can actually be allocated to (and possible all of them with a little persuasion from the right investor!). The average minimum investment size of these funds is US$2.7 million while the average redemption frequency is 6 weeks. In terms of fees, the average management fee of these top 25 is 1.5% while the average performance fee is 17.5%. Table 5 shows the annual turnover of the funds in the top 25 portfolio – the average turnover is 34%, which means that on average the 8 to 9 funds will be replaced in the portfolio each year. Table 5: Turnover rate of constituents of the Eurekahedge Asset Weighted top 25 funds
Source: Eurekahedge |
| Geographic mandates |
|---|
|
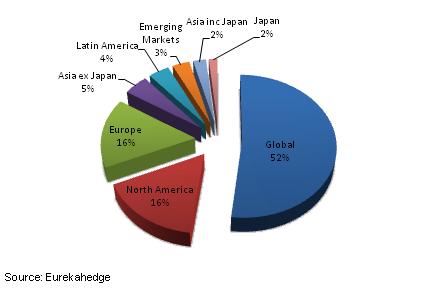
Global hedge funds account for 52% of the assets in the Eurekahedge Asset Weighted Index , which is hardly surprising as the largest funds invest with a global mandate. It should be noted that globally investing hedge funds allocate a significant amount of their assets to emerging markets, including Asia. Hedge funds investing solely in Asia account for nearly 10% of the index (Asia ex-Japan + Asia inc Japan + Japan), which is a unique and distinguishing aspect of the Eurekahedge Asset Weighted Index. Figure 4: Geographic mandates of Eurekahedge Asset Weighted Index constituents by AuM
This is an important advantage for observers as this geographical split of the index has greater coverage of the all regions, as opposed to most other hedge fund indices that only cover a fraction of Asian and European hedge funds. The comparative capitalisations of equity markets in America, Asia and Europe are 38%, 34% and 28%7 respectively, and as such any representative benchmark should have reasonable coverage of assets allocated to all these regions. |
| Strategic mandates |
|---|
|
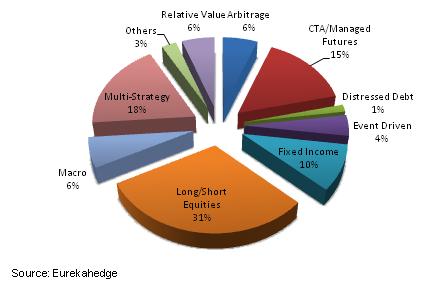
The distribution of the Eurekahedge Asset Weighted Index according to strategic mandates is broadly in line with the distribution of global hedge fund assets by strategies. Long/short equity and multi-strategy funds together account for 49% of total assets. Additionally, CTA/managed futures and fixed income funds account for 15% and 10% of the assets respectively, displaying an equitable distribution across the different asset classes as well as strategies. Figure 5: Strategic mandates of Eurekahedge Asset Weighted Index constituents by AuM
|
| Fund size breakdown | ||
|---|---|---|
|
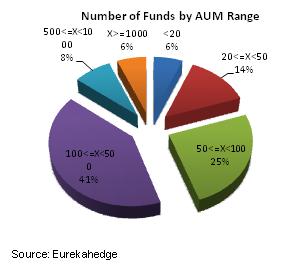
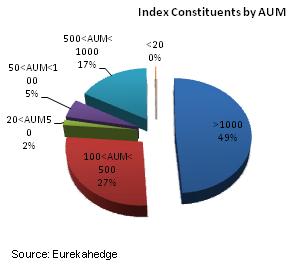
Figures 6a shows the number of funds in the index that fall in the different AuM ranges, while figure 6b shows the distribution of index assets amongst these different AuM ranges. Although the largest funds with more than US$1 billion form only 6% of the population, their assets account of 49% of the total assets in the index – as such these funds would have a greater impact on index movements, which is in contrast to equally weighted indices. Figures 6a-6b: Breakdown of Eurekahedge Asset Weighted Index constituents by fund size (US$ million)
|
| Performance Review |
|---|
|
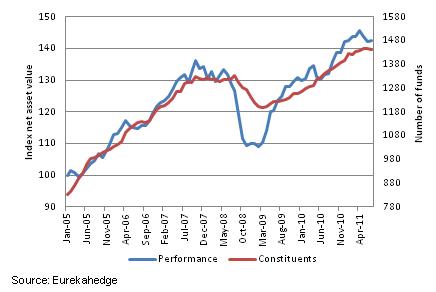
Figure 7 plots the number of index constituents against the performance of the Eurekahedge Asset Weighted Index . The sharp decline in the index from May 2008 onwards was followed by a drop in the number of constituents in 2H 2008 as the a number of funds closed down while other fell below the US$5 million exclusion criteria of the index and exited. Figure 7: Performance of the Eurekahedge Asset Weighted Index vs number of constituents
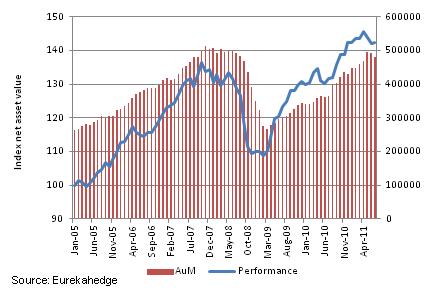
The assets covered by the index grew significantly between 2005 and 2008. The index gained 30.5% in performance between January 2005 and January 2008 whilst the assets covered by the index increased by 92.4%. However through the financial crisis, as the index declined by 15.4% between January 2008 and March 2009, the assets covered by the index declined by 47.2%. Since March 2009, the index has gained 27.8% (as at July 2011) while assets are up by 79.2%. The current size of the Eurekahedge Asset Weighted Index is 1441 funds and US$480 billion AuM. Figure 8: Performance of the Eurekahedge Asset Weighted Index vs total assets under management (US$ million)
|
| Conclusion |
|---|
|
While the Eurekahedge indices give a great overall indication of the performance of hedge fund managers in the industry the Eurekahedge Asset Weighted indices brings this to the next level by looking at the universe from an asset flow and investible perspective. They give an indication of real returns that can be generated in a practical fashion by investing in a passively managed and frequently rebalanced portfolio. The risk-return profiles of the Eurekahedge Asset Weighted indices, and a portfolio of funds based on the methodology, are superior to those generated by funds of hedge funds and by the equity markets –both in terms of annualised performance and volatility. The indices provide a more equitable distribution of assets across the different geographies (versus other comparable indices) whilst also displaying a low beta with the underlying markets. Additionally the indices provide excellent diversification across strategies and also cover a significant proportion of the assets in the hedge fund industry. As such these indices serve as an important benchmarking tool for any alternative portfolio and individual managers and can be fully customised for investment purposes as well. For more information on the Eurekahedge Asset Weighted Index , customised indices, datasets or any of our products please do not hesitate to contact us. |
| Contact us: |
|---|
|
Email: advisor@eurekahedge.com 3 Customised indices that take more factors into consideration such as redemption periods, liquidity, open/close etc. are |


